The reporting QuickBooks doesn't ship
SideQuest ships a self-contained operations dashboard for distributors automating POs into QuickBooks Online. Eighteen cards across six sections — throughput, review queue, customer health, pricing, catalog, activity — in one HTML file with sidebar navigation and dark mode. One command to refresh it. Runs offline. No SaaS, no auth, no data leaves your laptop.
sidequest dashboard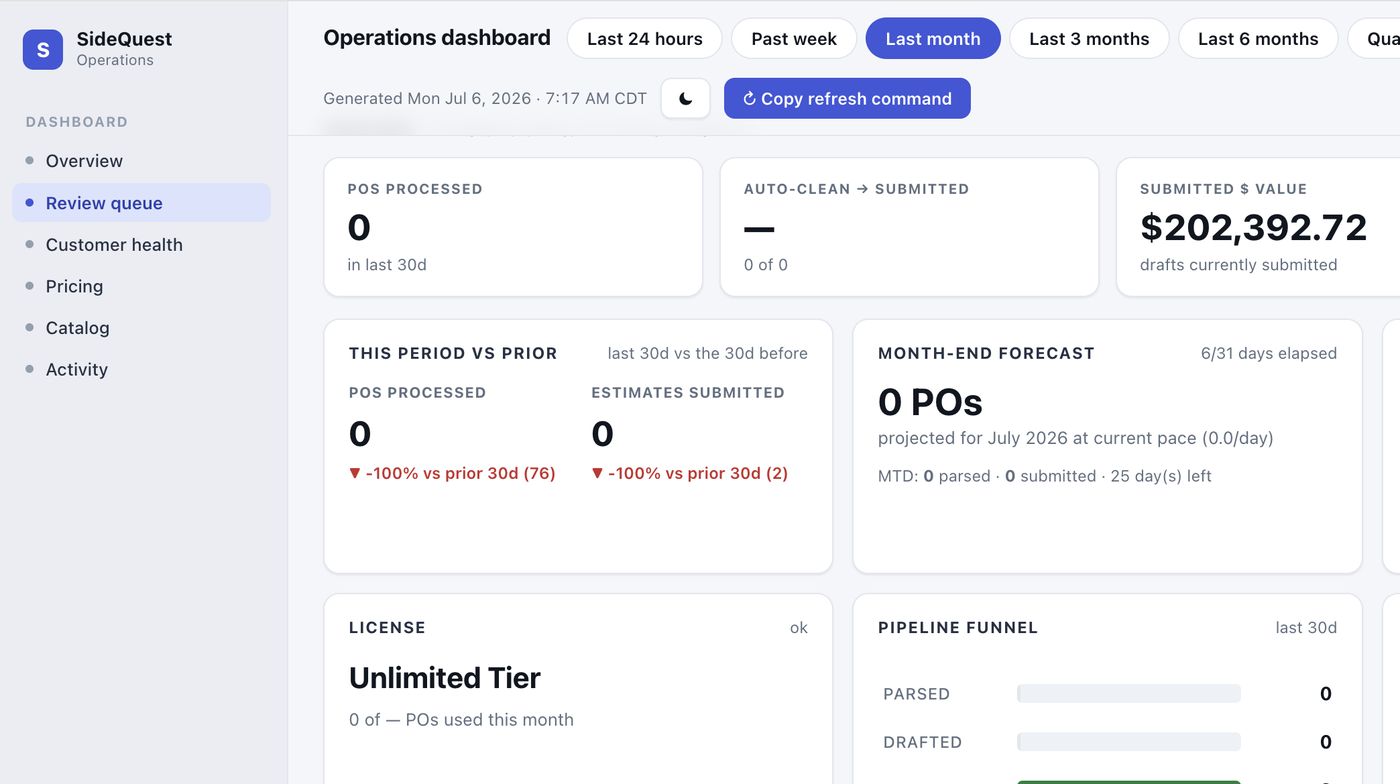
What's on it
Each section pulls from the local usage log and drafts store. Sections degrade independently: if QuickBooks auth drops, AR alone shows "unavailable" while everything else renders.
POs processed
Throughput for the period (today, 7d, 30d, MTD, YTD).
Auto-clean rate
What share of POs submitted without you touching them.
Submitted $ value
Total dollars on Estimates SideQuest pushed to QB.
AR open balance
Live from QuickBooks when AR sweep is configured.
This period vs prior
Real comparison vs the equivalent prior window, with arrow and percentage delta.
Auto-clean trend
30-day daily rate as an inline sparkline. Rising = matcher is learning.
Month-end projection
POs projected for the month at current pace. Red banner if you'll exceed quota.
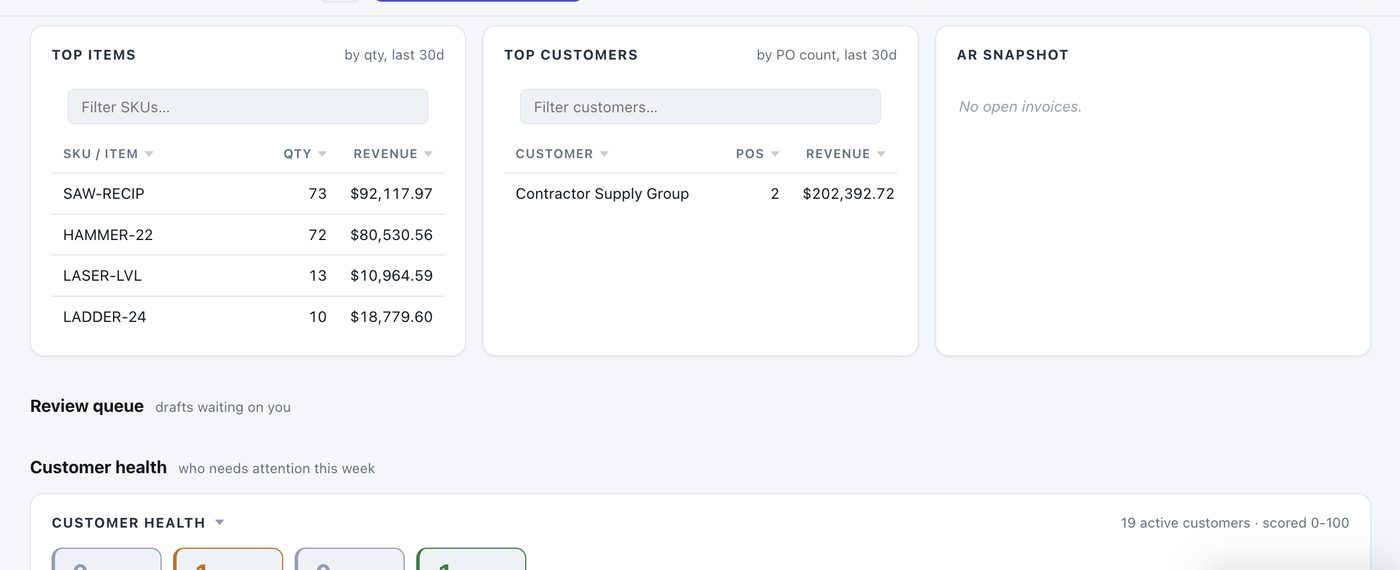
Customer concentration
Top customer's share of volume. Color-coded above 30% and 50%.
Oldest draft in review
Age of the longest-waiting draft. Fresh / aging / stale framing.
Pipeline funnel
Parsed → drafted → submitted → discarded, as a bar chart.
Match quality
Three-color bar (auto / you-assigned / needs-review) plus top review reasons in plain English.
Top unmatched parts
Customer part numbers seen more than once with no QB match. Single best ROI section.
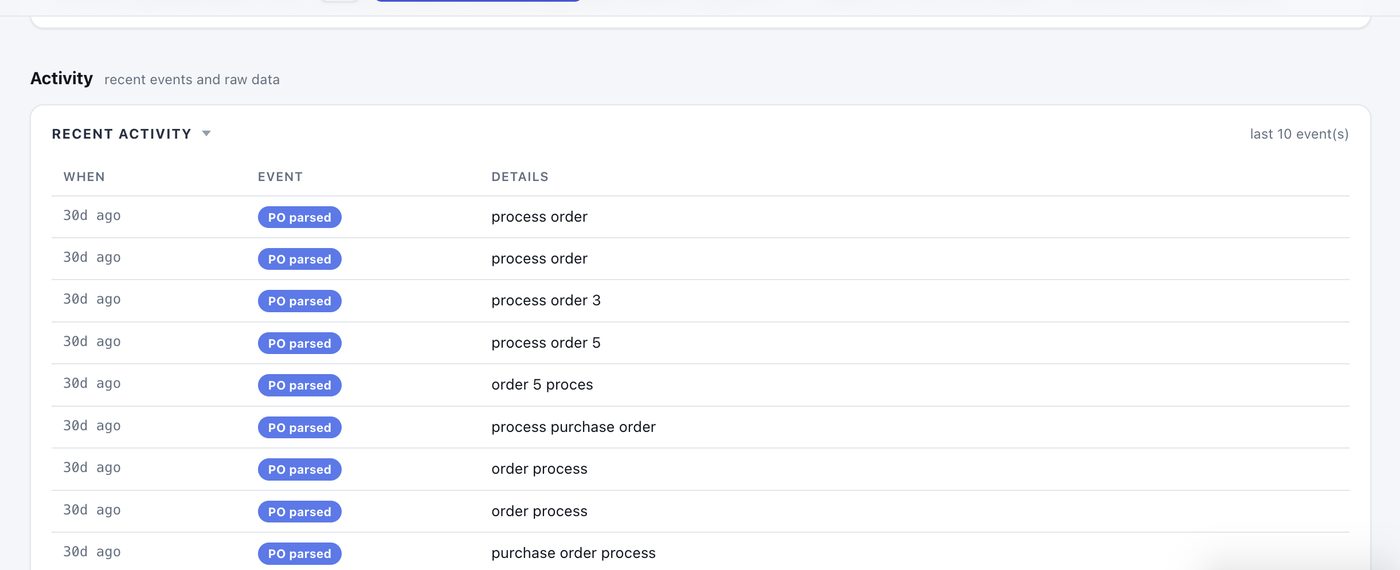
Recent activity feed
Last ten events with relative timestamps and event-type pills.
Walk the console
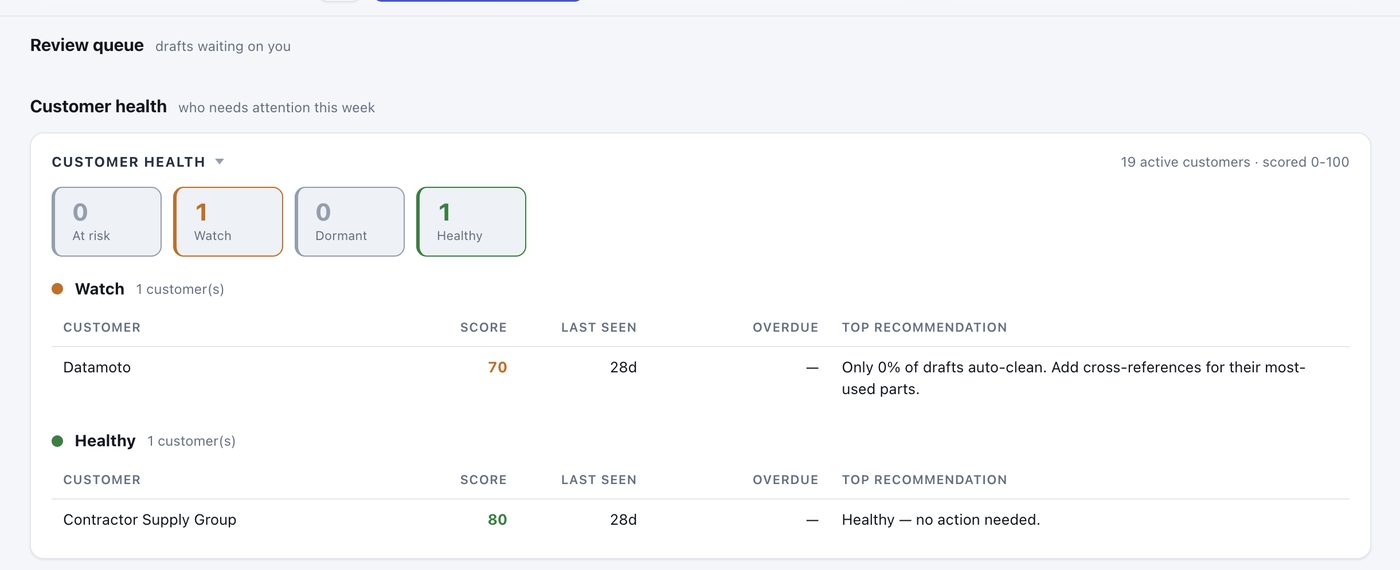
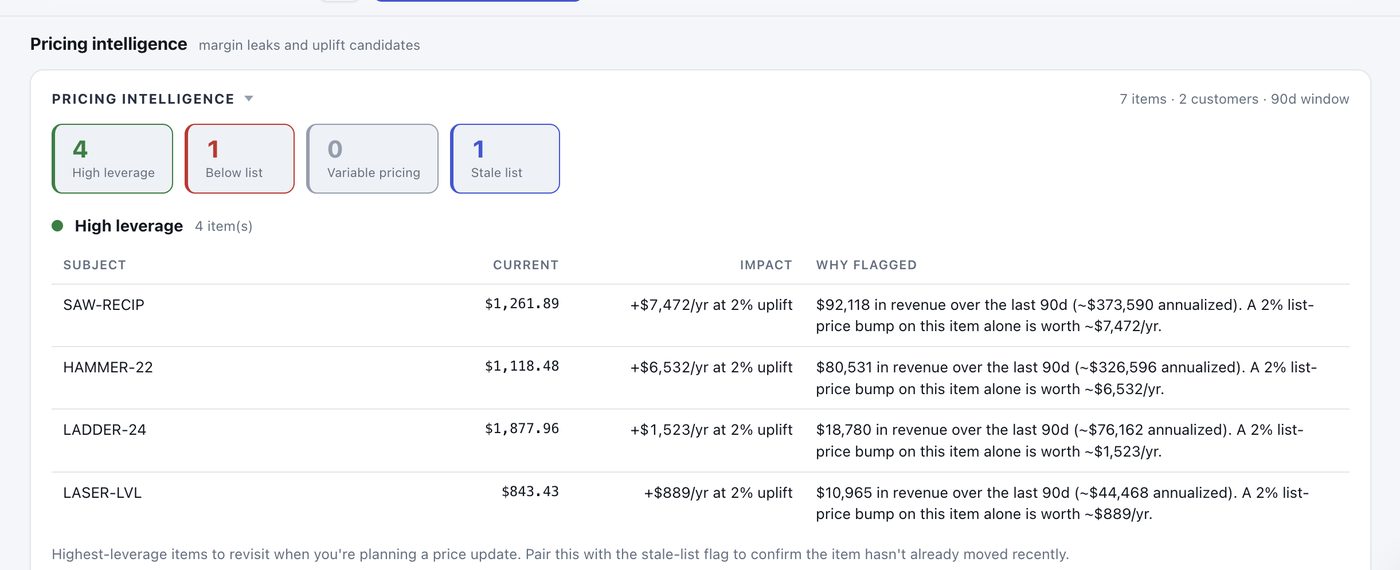
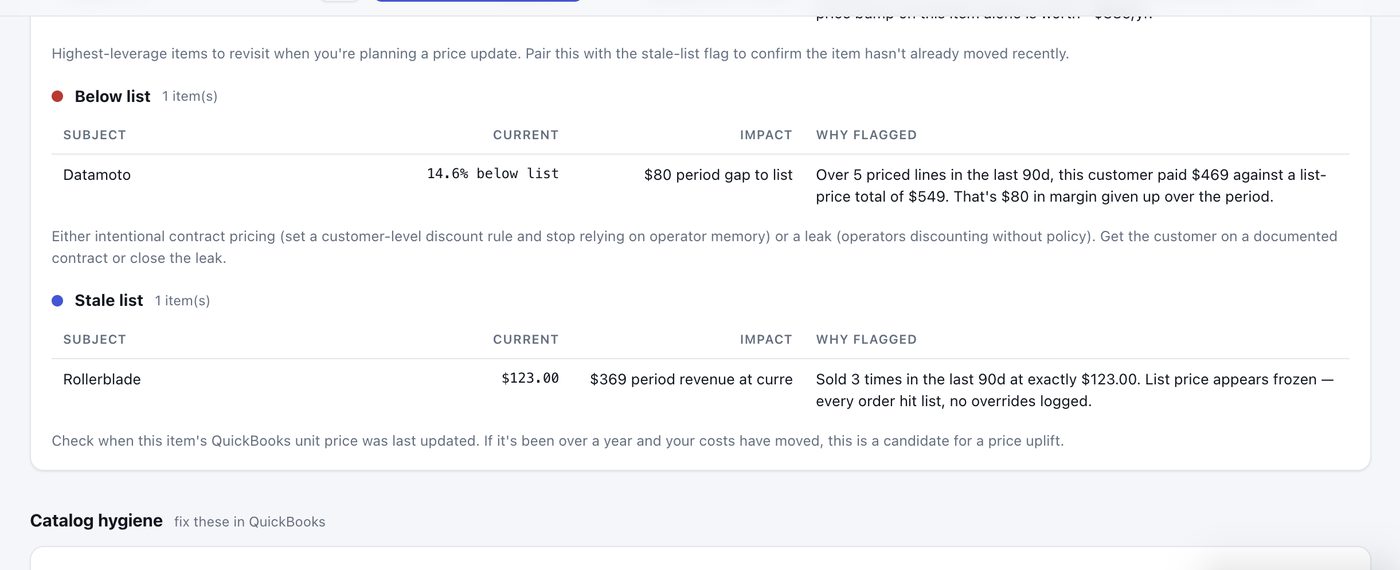
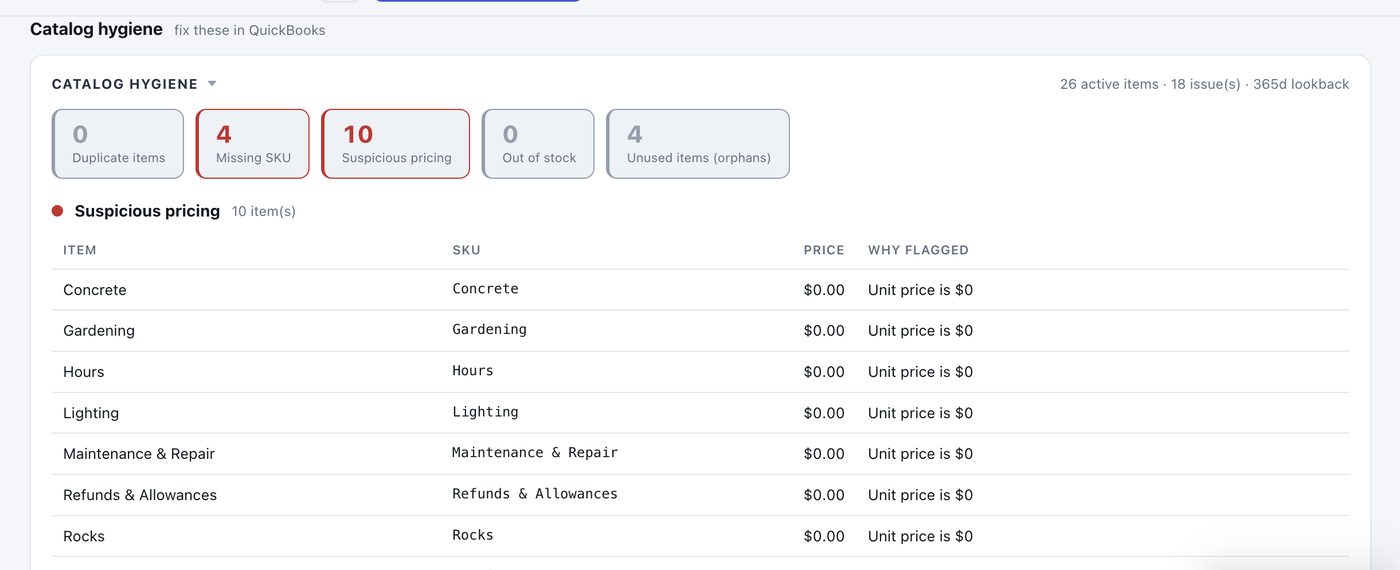
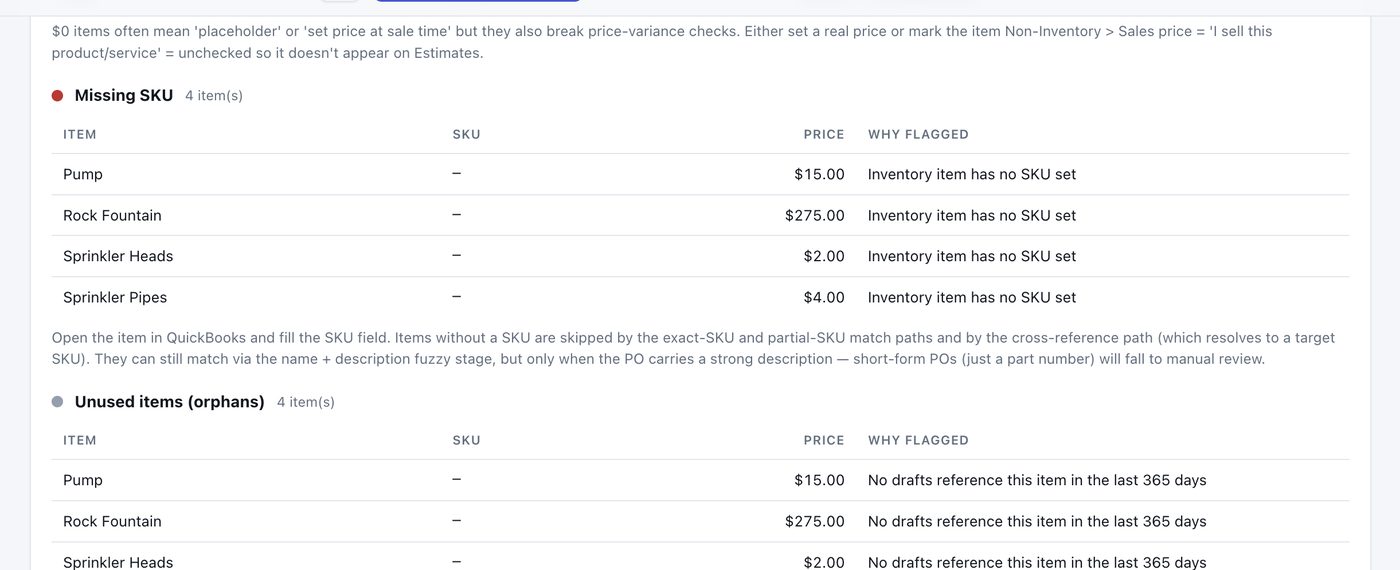
Every screenshot below is the real dashboard rendered from a live sandbox — same file your install produces. The sidebar jumps between sections; the period chips re-cut every number to the window you pick; the moon toggle flips the whole console to dark mode.
The three you'll use most
Top unmatched parts
Ranks customer part numbers that have failed the matcher more than once across the period. Add a cross-reference once for each one and the next five POs containing that part process clean. Compounds over time.
Customer concentration
Top customer's share of submitted volume, plus the top-3 share for context. Above 50% the section labels it "single-customer risk" in red. The number that should land on a board slide.
Month-end forecast
POs MTD ÷ days elapsed × days in month. License-aware: if the projection breaches your tier's quota, a red banner suggests planning the upgrade before month-end rolls over.
Why it's not in QuickBooks
QuickBooks Online's reporting layer runs against transactions. Your auto-clean rate is invisible to QBO because QBO never sees the drafts you discarded. Your customer part numbers that keep failing the matcher are invisible because QBO has no concept of an inbound PO that didn't become an Estimate. Your time saved is invisible because the alternative was a human typing line items, and QBO can't measure that.
| Metric | In QuickBooks Online? | In the SideQuest dashboard? |
|---|---|---|
| Submitted Estimate totals | Yes | Yes |
| AR aging | Yes | Yes |
| POs that came in but were never drafted | No | Yes |
| Drafts you discarded | No | Yes |
| Auto-clean rate trend | No | Yes |
| Customer part numbers that fail matching | No | Yes |
| Time saved vs typing | No | Yes |
| Month-end forecast vs license quota | No | Yes |
How to open it
Install the latest connector, then run one command:
~/.qb-distributor-mcp/venv/bin/pip install --force-reinstall \
  ~/Downloads/sidequest-connector.zip

# Cmd+Q Claude Desktop, reopen, then:
sidequest dashboard
The HTML file lands at ~/.qb-distributor-mcp/dashboard.html and your default browser opens to it. Re-run sidequest dashboard any time to refresh. Pass --period 7d for a tighter view, --no-open to skip the browser launch.
No JavaScript fetches, no external CSS, no fonts from a CDN. The file works offline. Move it to a USB stick, open it on a machine that's never seen the internet, the dashboard still renders. The raw underlying data sits in a collapsed JSON block at the bottom for export.